Course code: jcBAAP25
Analytics Management Advancement Program
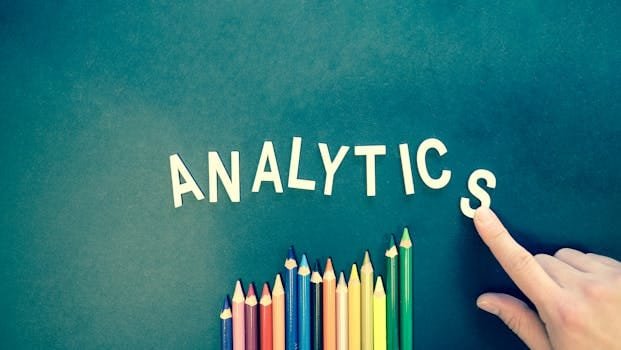
Empowering Decision-Making with Data-Driven Insights
Program Overview
A comprehensive program designed to help students of professional studies to master business analytics across all key business functions. Learn how to leverage data for strategic decision-making, performance optimization, and business growth with hands-on projects, real-world case studies, and expert mentoring.
Advanced Excel for Data Analytics & Business Insights
Master Excel for Data Analytics – Learn efficient navigation, shortcuts, data cleaning techniques, handling missing values, removing duplicates, and applying conditional formatting and advanced filtering.
Build Analytical Skills – Use lookup functions like VLOOKUP, HLOOKUP, XLOOKUP, INDEX-MATCH, and implement data validation, dropdowns, and forms for structured data entry.
Analyze Data Effectively – Apply statistical and regression analysis, forecasting, and scenario tools such as Goal Seek, Data Tables, and What-If Analysis to support business decisions.
Leverage Advanced Excel Tools – Summarize and explore data using Pivot Tables and Pivot Charts; automate data transformation with Power Query.
Visualize & Present Insights – Create dynamic dashboards, integrate Power BI for business intelligence, and develop compelling data stories using charts and graphs.
Automate & Optimize Workflows – Use Macros and VBA to automate repetitive tasks and streamline processes.
Understanding Business Analytics
- Explore the role of analytics in modern business environments.
- Understand how data supports strategic and operational decision-making.
- Learn about the types of analytics: descriptive, diagnostic, predictive, and prescriptive.
Data-Driven Decision-Making Framework
- Learn how businesses use data to identify problems, evaluate options, and make informed decisions.
- Understand the importance of aligning analytics with business objectives and KPIs.
- Study real-world examples of successful data-driven strategies.
Introduction to Key Analytical Tools
- Get an overview of essential tools like Python (for scripting and analysis), Tableau and Power BI (for visualization and dashboarding).
- Learn when and why to use each tool depending on the problem and data complexity.
- Understand the ecosystem of analytics tools used in different industries.
Data Collection Techniques
- Explore sources of business data – internal systems (ERP, CRM), online platforms, surveys, sensors, and public data sets.
- Learn about structured vs unstructured data, and best practices in data acquisition.
- Understand ethical considerations and compliance in data collection.
Data Cleaning & Preparation
- Understand the importance of clean, accurate data for analysis.
- Learn how to handle missing, duplicate, or inconsistent data.
- Use tools like Excel, Python (pandas), or Power Query for preprocessing tasks.
Data Visualization Essentials
- Learn principles of effective data visualization for business audiences.
- Practice using charts, graphs, and visual cues to uncover patterns and insights.
- Use Tableau and Power BI to build interactive reports and dashboards.
Business Intelligence & KPI Tracking
- Understand Business Intelligence (BI) concepts and how BI platforms help monitor performance.
- Identify and define Key Performance Indicators (KPIs) relevant to various business functions (sales, marketing, operations, finance).
- Learn to build dashboards for real-time performance monitoring and decision support.
Analytics Across Business Functions
Analytics Across Business Functions highlights how data is used across departments to improve decision-making and performance. In Marketing and Sales, analytics supports customer segmentation, digital campaign tracking, social media analytics, lead scoring, sales forecasting, and measuring customer lifetime value to drive growth and retention. Social media analytics helps track engagement, sentiment, and campaign effectiveness across platforms.
In Finance, data is used for budgeting, financial forecasting, risk management, cost optimization, and investment analysis. Operations applies analytics to demand forecasting, inventory control, logistics, supplier performance, and quality improvement. HR Analytics involves tracking employee performance, predicting attrition, planning workforce needs, and analyzing engagement. In Strategy, analytics enables competitive benchmarking, scenario planning, and identifying new growth opportunities through data-driven decision-making.
Live Projects and Specialization
- Build an end-to-end business analytics case study
- Optimize business performance using real data
- Apply analytics for business growth
Working Guidance, Coaching and Mentorship
- Weekly live Q&A and troubleshooting sessions
- Personalized career and business mentorship
- Resume, portfolio, and interview coaching for job seekers
- Data-driven decision-making support for business owners
Delivery and Enrollment Criteria
Industry Partner:
![]()
Eligibility:
- Students pursuing professional degrees (Commerce, Management, Finance, Engineering)
- Working professionals aiming for role transition or leadership growth
- Enrollment is available through tied-up degree courses with Pvt. / Govt. Universities and Colleges only
Mode: Hybrid (Live virtual sessions + In-person engagements)
Fees: Varies based on industry sponsorships, associations, and partnerships
Discover more from Offizkit
Subscribe to get the latest posts sent to your email.